DC Motor Efficiency- Numerous basic motor physics concepts must be addressed when selecting a DC Motor for an application or constructing a powered prototype to produce a safe, well-functioning, sufficiently-powered precision drive system. We’ve included some key methodologies, formulas, and calculation details in this post to help you figure out how to calculate the power output of a coreless motor, as well as the motor’s speed-torque curve, current, and efficiency graphs, and theoretical cold calculations to predict motor performance.
A visit to Linquip’s website will provide you with all of the information you need about DC motors, generators, and all of their associated equipment. Please feel free to reach out to our motor experts at Linquip anytime if you have any questions about them. To gain a better understanding of DC motors, you might find Linquip’s article “What Is A DC Motor?” helpful.
The Linquip website also offers the possibility of becoming a Linquip Expert, which will allow you to explore and use all its features. It will make it easier for you to demonstrate your skills to potential employers based on your experience working with industrial equipment. Do you think you could write a guest post for us? Guest Posting contributors can submit their content to the Linquip platform.
DC Motor Efficiency and Losses
This guide covers DC Motor efficiency and losses, such as Copper, Core, Brush, Mechanical (Friction and Windage), and Stray losses.
Friction, windage, and electrical losses are all losses in DC motors. In any rotating machinery, friction exists. Windage occurs as a result of air resistance to rotating components, as well as fans used to ensure forced air circulation for cooling.
Other losses in electrical devices include copper losses, iron losses, magnetic leakage, and other minor variables. These losses add up to wasted energy that should be minimized as much as possible, frequently through simple maintenance.
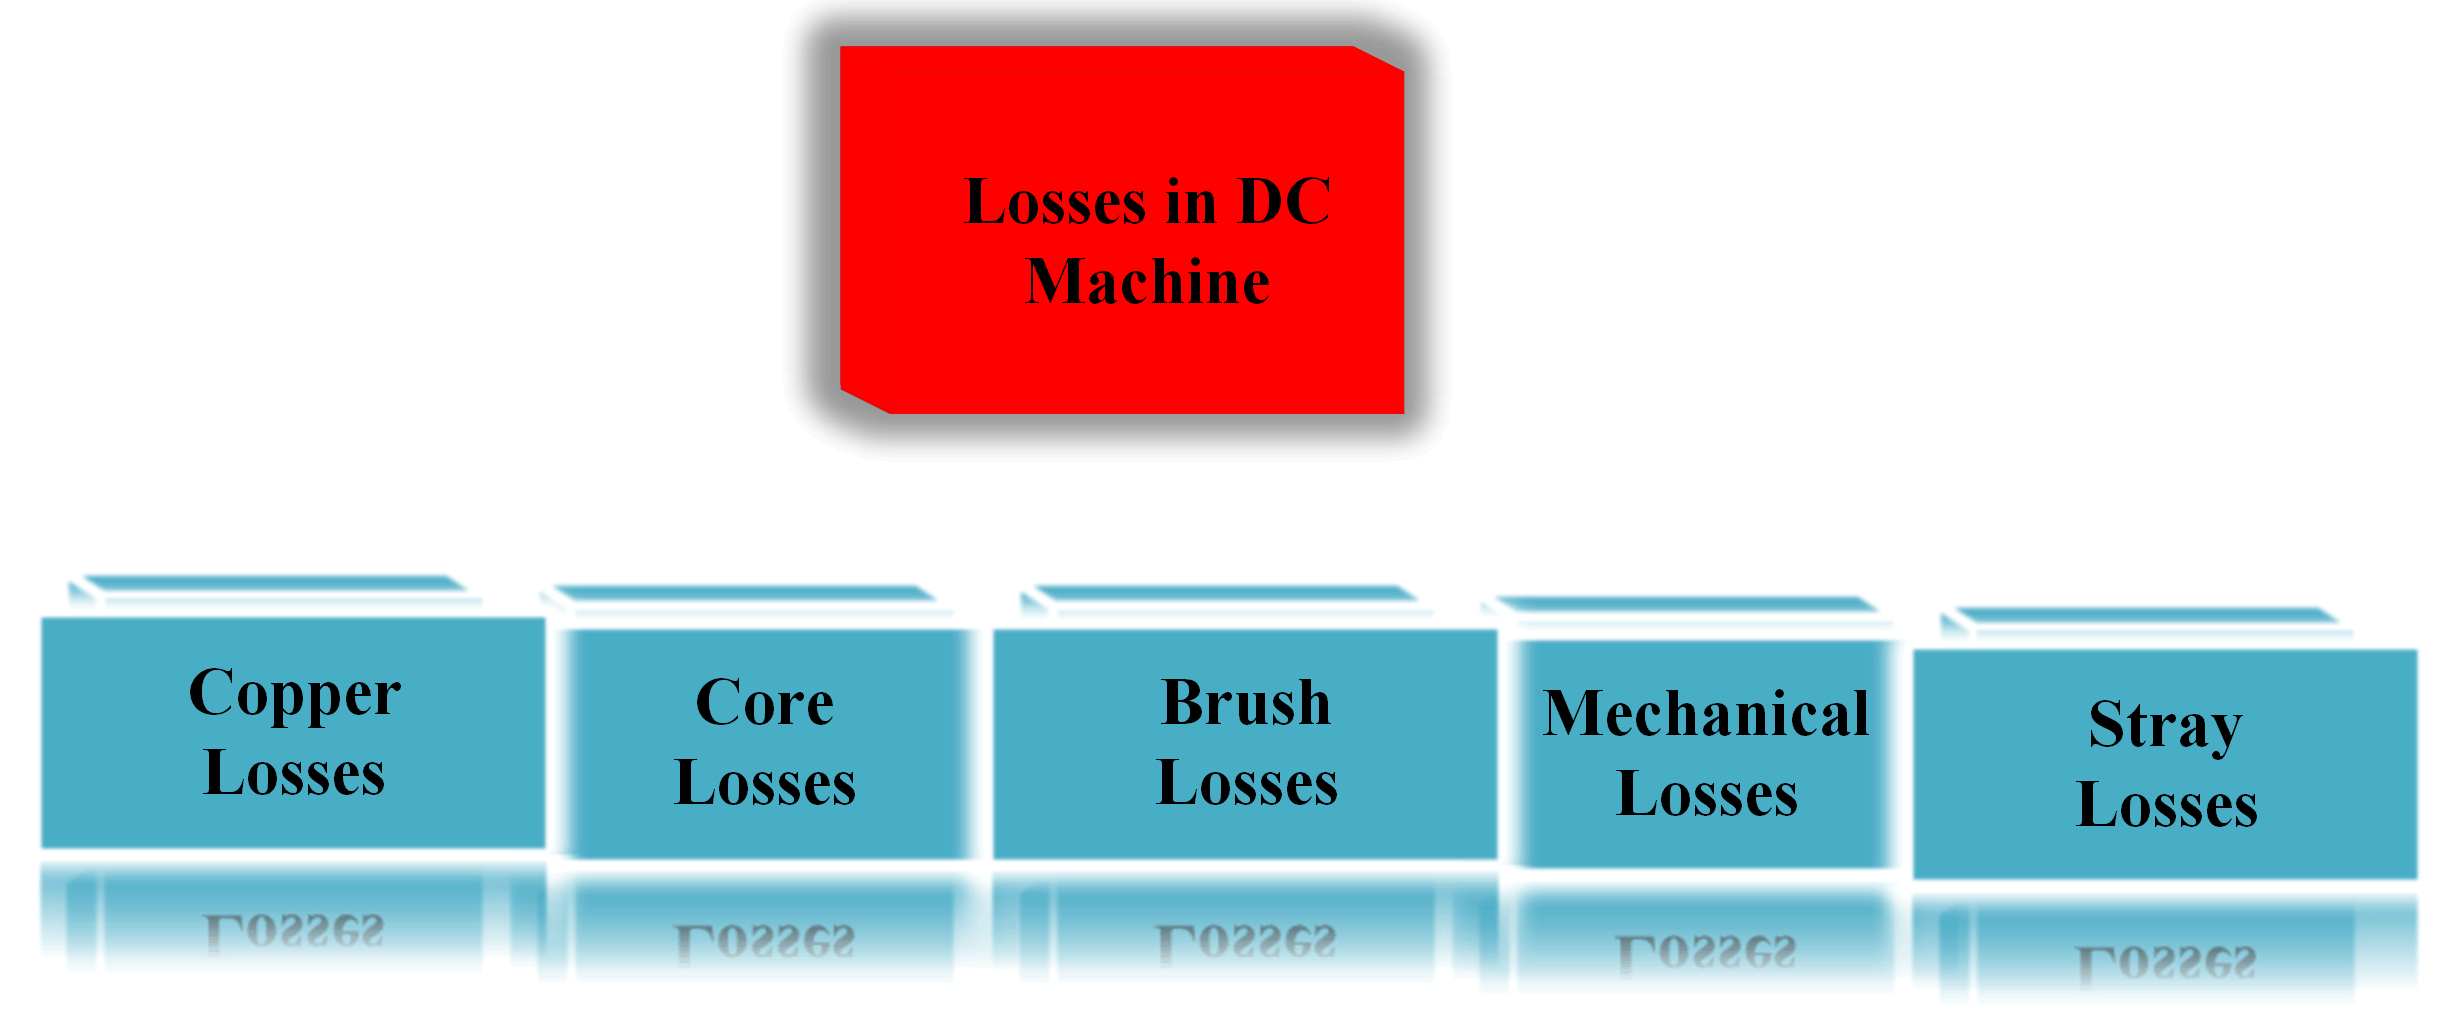
Copper power losses are caused by electrical winding resistance, whereas iron power losses are caused by hysteresis and eddy currents in the armature’s iron core. While the iron loss is nearly constant from no load to full load, the copper loss varies greatly depending on the load current. You can find more information about the different aspects of DC motor efficiency here.
These are the two most common electrical losses in motors, and they’ve been put together to get the total electric power loss. In copper conductors, power loss is proportional to the square of the current flowing (P = I2R).
Because of the low current flow at light loads, the copper loss is minimal. When the armature current is doubled, the copper loss is four times as big, and four times as much heat is generated; this heat must be eliminated, which is normally done through air circulation, which adds to the system’s loss.
Definition of DC Motor Efficiency
It’s common to presume that all of the armature resistance is concentrated in one component and not dispersed among the windings for analysis purposes. The figure below depicts a DC shunt-connected motor disassembled into its numerous hypothetical parts, with broken lines denoting actual components.
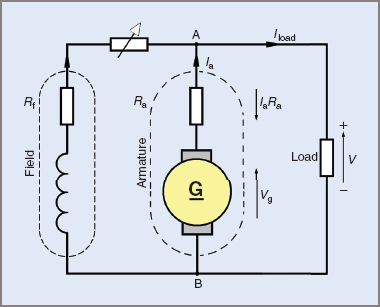
If the generator’s designed generated voltage is 200 V and the armature has a resistance of 0.5 Ω, the armature resistance causes an internal voltage drop of 0.5 V for every ampere of current supplied by the armature.
Internally, 1 V is lost for every 2 A of load current, therefore if 200 V is required at the device terminals, the producing section must provide a higher voltage in the windings. To supply a terminal voltage of 200 V between points A and B, the generated voltage for a 10 A load must be 205 V.
The armature current Ia includes both the field current If and the load current Iload, as Ia= If + Iload.
Internal resistance causes a voltage drop of IaRa (V = IR), and the produced voltage Vg equals the terminal voltage V plus the IaRa voltage drop. The field resistance must be added to the armature resistance when using a series field winding.
Finding Motor Parameters Empirically
Using the 2668W024CR coreless DC motor as an example, we’ve developed a method for determining the motor parameters. We’ll start with a more empirical method and then go on to a theoretical calculation.
The usage of torque-speed curves is a typical approach to graphically depicting motor properties. While torque-speed curves are more commonly used in the technical literature for bigger DC machines than for compact, ironless core devices, the concept can be used in either case.
Torque-speed curves are typically created by displaying motor speed, current, mechanical output power, and efficiency as functions of motor torque. The development of a set of torque-speed curves for a typical DC motor from a series of raw data measurements will be described in the following discussion.
The nominal voltage of the 2668W024CR is 24 V. You can measure the torque-speed curves for a 2668 CR series coreless dc motor at a specific operating point with a few basic pieces of laboratory equipment.
- Step 1: Measure Basic Parameters
Using a motion controller, such as one of the FAULHABER MC3 motion controllers, several parameters can be acquired immediately. The FAULHABER Motion Manager, for example, provides a trace recording function that plots voltage, current, efficiency, speed, and other parameters. They can also provide a highly detailed snapshot of motor activity. The MC3 motion controllers (the MC 5004, MC 5005, and MC 5010), for example, can all measure a variety of motion characteristics. This is the easiest way to get the data you need to plot a torque-speed curve, but it’s not the only way.
If a controller with trace recording capacity is not available, we can characterize a motor with some simple lab equipment under the stall, nominal, and no-load situations. Run the 2668W024CR unloaded with a power supply set to 24 V and measure the rotating speed using a non-contacting tachometer (a strobe, for instance). Measure the motor current in this no-load situation as well.
Because it does not introduce resistance in series with the driving motor, a current probe is perfect for this measurement. A load can be attached to the motor shaft using an adjustable torque load, such as a small particle brake or an adjustable hysteresis dynamometer.
Increase the motor’s torque to the point where it stalls. Measure the torque generated by the brake and the motor current at the stall. Assume that the coupling adds no load to the motor and that the load from the brake does not include unknown frictional components for the sake of this discussion. It’s also a good idea to check the motor’s terminal resistance at this point. Using an ohmmeter, measure the resistance between the motor terminals.
Take another measurement after spinning the motor shaft. The values of the measures should be extremely near. Continue to spin the shaft and take three measurements at a time. This ensures that the measurements are not taken at the commutator’s point of minimum contact.
Now we have measured the:
- I0 = No-Load current
- n0 = No-Load speed
- R = Terminal Resistance
- MH = Stall Torque
- Step 2: Plot Current vs. Torque and Speed vs. Torque
Prepare a graph with the abscissa (horizontal axis), speed on the left ordinate (vertical axis), and current on the right ordinate. Scale the axes based on the first step’s measurements. Draw a straight line from the graph’s left origin (zero torque and zero current) to the right-side ordinate’s stall current (stall torque and stall current).
A plot of motor current as a function of motor torque is shown by this line. The current constant kI is the proportionality constant for the relationship between motor current and motor torque (in units of current per unit torque or A/mNm) and is the slope of this line. The torque constant kM (in units of torque per unit current or mNm/A) is the reciprocal of this slope. (KI=1/KM)
The motor will be assumed to have no internal friction for the purposes of this discussion. The motor friction torque MR is calculated by multiplying the motor’s torque constant kM by the measured no-load current I0 in practice. The torque vs. speed and torque vs. current lines begin at an offset on the horizontal axis equal to the computed friction torque, rather than at the left vertical axis.
- Step 3: Plot Power vs. Torque and Efficiency vs. Torque
Two extra vertical axes can usually be added to plot power and efficiency as functions of torque in most circumstances. A third vertical axis can be utilized for power, while a second vertical axis is normally used for efficiency. Efficiency vs. torque and power vs. torque will be presented on the same graph as the speed vs. torque and current vs. torque plots to keep things simple.
Make a table of the motor’s mechanical power at different positions, from no load to stall torque. Because mechanical power output is just the product of torque and speed multiplied by a unit correction factor, power may be computed using the previously plotted speed vs. torque line.
The resulting function, as shown in the graph below, is a parabolic curve. At half of the stall torque, the maximum mechanical power is reached. At this moment, the speed is roughly one-half of the no-load speed.
Make a table of the motor efficiency at various positions from no-load speed to stall torque on a spreadsheet. The motor’s voltage has been specified, and the current at various torque levels has been shown. The power input to the motor is the product of the motor current and the applied voltage. The efficiency of the motor is defined as the mechanical power output divided by the electrical power input at each calculation step. At around 10% of the motor stall torque, maximum efficiency is reached.
Characteristic Curves of Motor
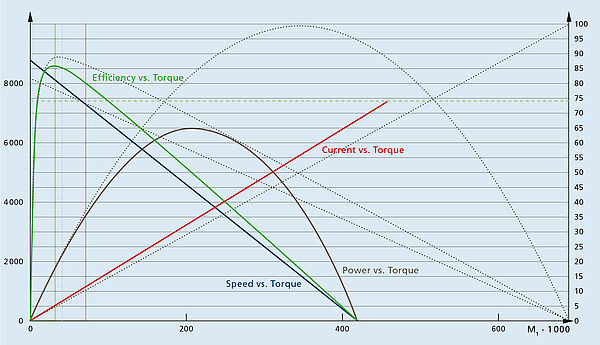
- Plot definitions
Blue = Speed vs. Torque (n vs. M)
Green = Efficiency vs. Torque (η vs. M)
Red = Current vs. Torque (I vs. M)
Brown = Power vs. Torque (P vs. M)
The solid lines account for the impacts of magnet and coil heating on a warm motor, whereas the dotted lines show values that might be plotted from a cold motor (no temperature rise) (more on this later). Owing to increased resistance in the copper windings and weaker torque output due to heat rise, all four solid graphs change. As a result, depending on whether your motor is cold or warm when you plot your graphs, your results may vary slightly.
As can be seen, when the temperature rises, the torque constant weakens, as does the Back-EMF constant. Because the coil resistance, torque constant, and back-EMF constant of the motor are all functions of temperature, they are all negatively influenced.
We could calculate more parameters as a result of the hotter coil and magnet, but the greatest results come from performing several iterations, which is best done with quantitative software. As the temperature of the motor rises, each of the three characteristics will change, degrading motor performance and increasing power losses.
Continuous operation can cause a motor to reach a point of “thermal runaway,” which can cause permanent damage to the motor. Even if early calculations showed an acceptable temperature rise, this can happen (using values of R and kM at ambient temperature).
The maximum permissible current through the motor windings can be increased by lowering the motor’s thermal resistance. The thermal resistance Rth1 between the rotor and the casing is mostly determined by the motor design. The inclusion of heat sinks can greatly reduce the case-to-ambient thermal resistance Rth2.
Small DC motor thermal resistances are often specified with the motor suspended in free air. As a result, just installing the motor within a thermally conductive framework or chassis usually results in some heat sinking. Thermal resistance is specified by certain manufacturers of bigger DC motors when the motor is placed into a metal plate of established dimensions and material.
What Is the Most Efficient DC Motor?
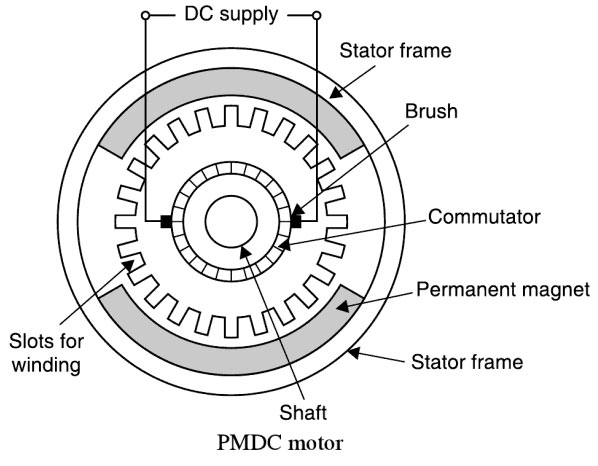
Permanent magnet brush DC motors use permanent magnets in their stator to eliminate the need for external field currents. Compared to other brush DC motor types, it is available in a smaller size, is lighter, and has a higher energy efficiency; it is widely used in low-power applications up to two horsepower.
Download DC Motor Efficiency PDF
If you wish to keep this PDF document for future reference, you may download it to your computer. Click on the link below to download it.
Buy Equipment or Ask for a Service
By using Linquip RFQ Service, you can expect to receive quotations from various suppliers across multiple industries and regions.
Click Here to Request a Quotation From Suppliers and Service Providers
Read More In Linquip
- Efficiency of Inverter
- Electric Heater Efficiency and Running Costs
- Efficiency of Fuel Cell: Calculation Formula & Equation
- Space Heater Efficiency For Various Types of Heater
- Heater Efficiency Calculation: Formula & Equation
- Fan Efficiency Calculation: Formula & Equation
- Efficiency of Wind Turbines
- Efficiency of Diesel Generators Calculation: Formula & Equation
- Calculation of Pump Efficiency: Formula & Equation
- Energy Efficient Electric Heater: A Practical Guide
- What is Generator Efficiency? Calculation & Formula Guide
- Efficiency of Induction Motor: Calculation & Equation
- Difference Between Cell and Battery: Ultimate Guide
- DC Motor Parts, Structure, Design and Advantages
- All About DC Motor Types and Their Applications
- DC Motor Working Principles : The Most Compendious Reference

